The top 5 best states to apply for disability benefits in 2025 are:
Chances are good that you or someone you know is affected by a debilitating medical condition. In the United States, millions of residents suffer from thousands of different diagnoses that leave them immobilized, in pain, and unable to work.
Luckily, for those affected, Social Security disability benefits can help ease the financial burden of living with these medical conditions.
Understanding Social Security Disability Benefits
There are two types of disability benefits offered by the U.S. Social Security Administration (SSA)—Social Security Disability Insurance (SSDI) and Supplemental Security Income (SSI).
SSDI Basics
Social Security Disability Insurance (SSDI) is a federal program designed to provide financial assistance, in the form of monthly benefit checks, to individuals who once were able to work but can't work anymore due to a disabling condition.
- How Much Money You Can Receive from SSDI Each Month. The amount of SSDI benefits you receive is based on your average lifetime earnings before your disability began. The Social Security Administration (SSA) calculates your benefit amount using your earnings history and a complex formula. The average monthly benefit amount varies by state and individual circumstances. There is a maximum monthly benefit amount set by the SSA, which is adjusted annually for inflation. For eligible individuals, the maximum SSDI payment is $45,864 annually ($3,822 monthly) in 2024 (up from $43,524 annually ($3,627 monthly) in 2023).
- SSDI Eligibility Criteria. To qualify for SSDI benefits, there are specific eligibility criteria you must meet. Firstly, you must have a disabling condition. This condition should both prevent you from engaging in substantial gainful activity (SGA) and be listed in the SSA's Blue Book, also known as their "Listing of Impairments". Additionally, this condition must be expected to last at least 12 months or result in death. Furthermore, it's essential that you have worked in jobs covered by Social Security, earning enough work credits through payroll taxes, to be considered "insured" for SSDI benefits.
- SSDI Benefits’ Impact on People’s Quality of Life. SSDI benefits can—and oftentimes do—have a major positive impact on recipients’ quality of life. This is the case for a variety of reasons. First, SSDI benefits can provide financial stability for individuals who are unable to work due to disability, helping cover essential living expenses such as housing, food, and medical care. However, it is important to note that the amount received from SSDI benefits for every recipient may not always be sufficient to maintain the same standard of living as when the individual was employed. Second, SSDI beneficiaries may also qualify for additional assistance programs, such as Medicaid or Medicare, which can help offset healthcare costs.
SSI Basics
Supplemental Security Income (SSI) is a federal program that provides financial assistance to low-income individuals who are aged, blind, or disabled.
- How Much Money You Can Receive from SSI Each Month. The amount of SSI benefits you receive is determined based on federal benefit rates* set by the SSA. These rates may be adjusted annually for cost-of-living increases. In 2024, the federal benefit rate (i.e., the maximum monthly SSI payment) is $943 per month for individuals and $1,415 per month for couples. In addition to the federal benefit rate, some states may provide a supplemental payment to individuals receiving SSI, which can vary depending on the state of residence.
- *Understanding the Federal Benefit Rate (FBR). The Federal Benefit Rate (FBR) sets the highest amount of money you can get from SSI and acts as a limit on how much income you can have. It's adjusted based on changes in the cost of living, like the 3.2% COLA increase in 2024. Other state and federal benefits are also based on the FBR. This rate ensures that individuals receiving SSI have their benefits adjusted to reflect changes in living expenses and maintain their standard of living.
- SSI Eligibility Criteria. To qualify for SSI benefits, you must have limited income and resources. The SSA considers income from sources such as wages, Social Security benefits, and pensions, as well as assets like cash, bank accounts, and property. You also must be aged 65 or older, blind, or disabled to qualify for SSI. The SSA defines disability for SSI purposes similarly to the definition used for SSDI—meaning your disability must fit their definition of disability and criteria for benefits. But, unlike SSDI, eligibility for SSI is based on financial need instead of work history (and work credits). As such, individuals who have not worked or earned enough work credits for SSDI may still qualify for SSI if they meet the income and resource requirements.
- SSI Benefits’ Impact on People’s Quality of Life. SSI benefits can have a significant impact on the quality of life for eligible individuals, providing essential financial support for basic needs such as food, clothing, and shelter. For many recipients, SSI benefits may be the primary or sole source of income, particularly for those who are unable to work due to disability. As such, access to SSI benefits can alleviate financial stress and improve overall well-being by ensuring access to necessary resources and services. Additionally, SSI recipients may qualify for other assistance programs, such as Medicaid, which can help cover healthcare costs and further enhance quality of life.
Both types of disability benefits (SSDI and SSI) are overseen by the SSA. As per SSA statistics from February 2024, approximately 8.4 million individuals classified as disabled workers are currently receiving SSDI benefits from the SSA, while slightly more than 6.5 million individuals are beneficiaries of SSI.
The application process for both of these programs can be—and oftentimes is—very long and challenging. On top of this, approximately 1/3 (only 35%) of all initial disability benefits applications were approved by the SSA in 2023. Approximately 13% of applications were approved at the reconsideration stage (i.e. the first appeal stage), and 54% of disability claims were approved at the hearing stage (the second—and typically the—last appeal stage).
The graphic below shows the top 10 states with the highest Social Security Disability Insurance (SSDI) and Supplemental Security Income (SSI) disability hearing approval rates in 2024.
Top 5 Best States for Disability Benefits
Below are the top five states most likely to approve disability applications in 2024* according to the SSA:
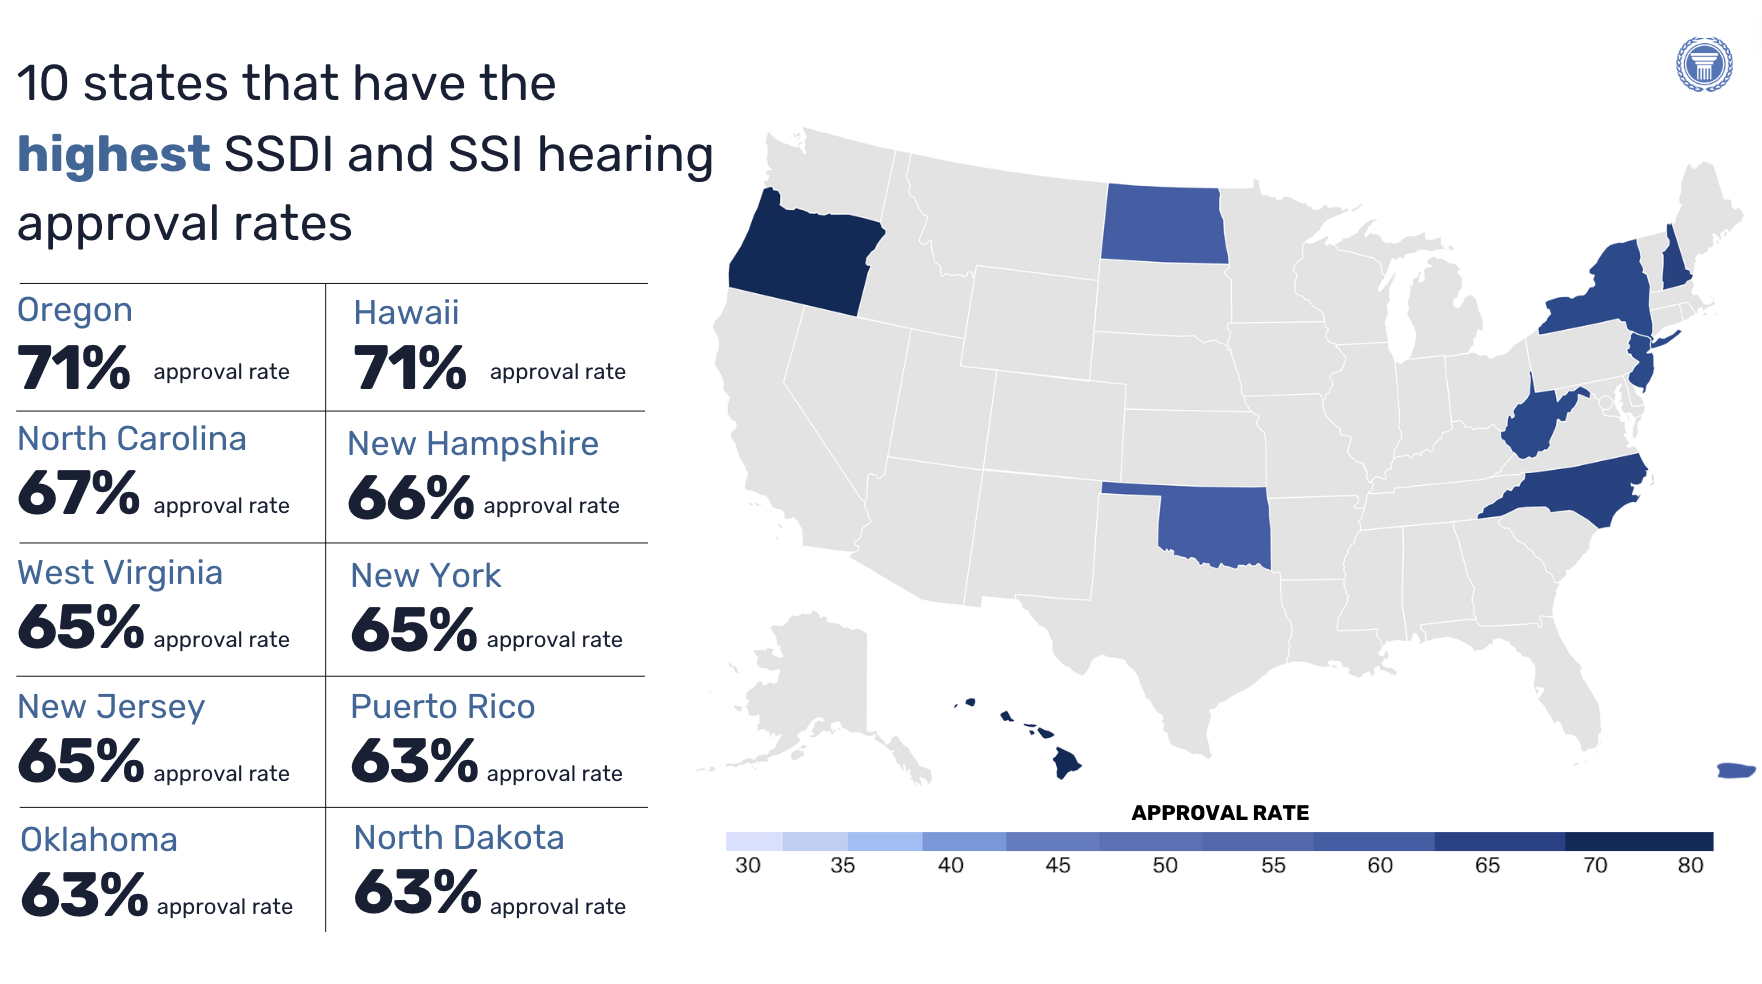
#1 Oregon: 71.40% Approval Rating
According to data released by the CDC, 28% of adults living in Oregon have a disability.
Every year, the state of Oregon spends up to 40% of the state’s budget (around $11.9 billion) on healthcare. Breaking this statistic down a little more, the state of Oregon spends approximately $16,127 per Oregon resident with a disability.
Currently, 83,635 Oregon residents are receiving SSI benefits, and 106,233 Oregon residents are receiving SSDI benefits from the SSA (last updated: March 20, 2024).
Contact an Oregon Disability Lawyer today if you’re an Oregon resident seeking disability benefits.
#2 Hawaii: 71.16% Approval Rating
According to data released by the CDC, 21% of adults in Hawaii have a disability of some sort in 2024. With a disability approval rating of 71.16% as of February 2024, more than half of disability applicants of all ages receive benefits from Social Security.
Furthermore, Hawaii has had a consistent and impressive ranking above the other 49 states in terms of disability healthcare support and spending over the past few years. According to Data from the CDC, HealthData.gov, and the Kaiser Family Foundation, Hawaii was the top state for health care in the U.S. in 2023. Hawaii spends approximately $3 billion annually on health care. Breaking this down even further, the state of Hawaii spends approximately $17,721 per Hawaiian resident with a disability(s).
Currently, 21,456 Hawaii residents are receiving SSI benefits, and 22,363 Hawaii residents are receiving SSDI benefits from the SSA (last updated: March 20, 2024).
Contact a Hawaii Disability Lawyer today if you’re a Hawaii resident seeking disability benefits.
#3 North Carolina: 67.38% Approval Rating
According to the CDC, 29% of adults in North Carolina have a disability(s) in 2024. This is equivalent to 2,460,352 adults—or approximately 1 in 3 adults—in North Carolina.
North Carolina spends up to 36% ($25 billion) of the state’s budget for health care spending annually. Looking at this statistic on a per-person basis, North Carolina spends approximately $15,230 per North Carolina resident with a disability.
Currently, 216,756 North Carolina residents are receiving SSI benefits, and 331,226 North Carolina residents are receiving SSDI benefits from the SSA (last updated: March 20, 2024).
Contact a North Carolina Disability Lawyer today if you’re a North Carolina resident seeking disability benefits.
#4 New Hampshire: 66.11% Approval Rating
In 2024, 26% of people living in New Hampshire reported living with one or more disabilities, compared to the 13.5% rate of disability in the United States as a whole.
As of January 2024, 73.66% of New Hampshire residents with disabilities (ages 21-64) were receiving SSI benefits.
New Hampshire spends up to 31% ($3.7 billion) of the state’s budget for health care spending annually. Looking at this statistic on a per-person basis, New Hampshire spends approximately $17,463 per New Hampshire resident with a disability.
Currently, 16,527 New Hampshire residents are receiving SSI benefits, and 50,207 New Hampshire residents are receiving SSDI benefits from the SSA (last updated: March 20, 2024).
Contact a New Hampshire Disability Lawyer today if you’re a New Hampshire resident seeking disability benefits.
#5 West Virginia: 64.96% Approval Rating
In 2024, 36% of West Virginians reported living with one or more disabilities, compared to the 13.5% rate of disability in the United States as a whole.
As of January 2024, 68.93% of West Virginia residents with disabilities (ages 21-64) were receiving SSI benefits.
West Virginia spends up to 40% ($6.7 billion) of the state’s budget for health care spending annually. Looking at this statistic on a per-person basis, West Virginia spends approximately $15,494 per West Virginia resident with a disability.
Currently, 64,747 West Virginia residents are receiving SSI benefits, and 87,569 West Virginia residents are receiving SSDI benefits from the SSA (last updated: March 20, 2024).
Check our resources for West Virginia Social Security benefits if you’re a West Virginia resident seeking benefits.
Related: How much do states give out in disability benefits each year?
Social Security Disability Benefits Approval Rates by State in 2024
The following table breaks down SSI and SSDI approval rates by state. You will see the term “allowance rate” in the chart below. The term “allowance” is a term used by the SSA to describe the rates for both initial disability benefits applications as well as reconsiderations. An allowance denotes the individual was medically approved for disability, however, they still might be denied if they fail to meet the SSA’s technical requirements for disability (e.g., having enough work credits to be eligible for SSDI).
2024* Disability Approval Rates By State
| State | Total Fully Favorable Decisions (%age) | Total Partially Favorable Decisions (%age) | State Approval Rates (%age) |
| Oregon | 88.26% | 11.74% | 71.40% |
| Hawaii | 84.97% | 15.03% | 71.16% |
| North Carolina | 87.72% | 12.28% | 67.38% |
| New Hampshire | 88.29% | 11.71% | 66.11% |
| West Virginia | 88.42% | 11.58% | 64.96% |
| New York | 86.74% | 13.26% | 64.51% |
| New Jersey | 82.21% | 17.79% | 64.50% |
| Puerto Rico | 80.94% | 19.06% | 63.08% |
| Oklahoma | 85.98% | 14.02% | 63.01% |
| North Dakota | 87.16% | 12.84% | 63.84% |
| Alabama | 90.41% | 9.59% | 62.64% |
| Maryland | 82.99% | 17.01% | 62.46% |
| South Carolina | 86.25% | 13.75% | 62.27% |
| Minnesota | 84.69% | 15.31% | 61.33% |
| Massachusetts | 81.17% | 18.83% | 60.80% |
| Tennessee | 86.49% | 13.51% | 60.54% |
| Delaware | 88.00% | 12.00% | 60.48% |
| California | 82.80% | 17.20% | 60.25% |
| Maine | 83.53% | 16.47% | 59.86% |
| Indiana | 85.82% | 14.18% | 59.80% |
| Florida | 87.38% | 12.62% | 59.56% |
| Wisconsin | 81.18% | 18.82% | 59.10% |
| Michigan | 82.41% | 17.59% | 59.08% |
| Mississippi | 89.93% | 10.07% | 58.23% |
| Rhode Island | 88.84% | 11.16% | 57.82% |
| District of Columbia | 81.42% | 18.58% | 57.65% |
| Georgia | 85.46% | 14.54% | 57.54% |
| Kentucky | 86.53% | 13.47% | 57.26% |
| Arizona | 84.35% | 15.65% | 56.98% |
| Ohio | 83.87% | 16.13% | 56.66% |
| Connecticut | 82.15% | 17.85% | 56.17 |
| Montana | 77.30% | 22.70% | 56.06% |
| Washington | 86.29% | 13.71% | 55.09% |
| Pennsylvania | 81.85% | 18.15% | 54.77% |
| Illinois | 82.54% | 17.46% | 54.62% |
| Arkansas | 84.58% | 15.42% | 54.54% |
| Kansas | 87.88% | 12.12 | 54.23% |
| Colorado | 82.27% | 17.73% | 53.65% |
| Texas | 84.21% | 15.79% | 53.51% |
| Iowa | 73.08% | 26.92% | 53.17% |
| Virginia | 80.44% | 19.56% | 53.07% |
| New Mexico | 81.57% | 18.43% | 52.66% |
| Louisiana | 80.43% | 19.57% | 52.62% |
| Missouri | 80.48% | 19.52% | 51.55% |
| Nebraska | 80.99% | 19.01% | 51.49% |
| Nevada | 81.91% | 18.09% | 50.64% |
| Utah | 73.38% | 26.62% | 44.64% |
*This table was updated using the most recent data released by the SSA in February 2024. We will update this chart as more data becomes available.
Related: Can I work with a Social Security attorney from another state?
What Is The Hardest State To Get Disability Benefits?
As of January 2024, Utah replaced Kansas as being the hardest state to get Social Security disability benefits in 2024. 
As of the most recent data released to the public by the SSA (February 2024), Utah had an approval rate of 44.64%—1 percentage point lower than the national average. While applying for disability benefits in Utah might not be advantageous for getting your claim approved, it does not mean that it's impossible to get approved for benefits in this state. Despite Utah's low approval rate, there are many people living in Utah who do get approved for disability. This is because getting approved for disability relies on each applicant's disabling condition(s), circumstances, and situation.
Nevada has the second-worst SSD application approval rate in the U.S., with only 50.64% of applications getting approved (as of February 2024).
Take 2 Minutes To See If You Qualify
If you feel that you may qualify for disability benefits, regardless of what state you live in, it is always worth it to apply. And, when applying for benefits, it is also wise to consult with a disability advocate or attorney.
A disability attorney is an irreplaceable—and often is an invaluable—resource when filling out disability benefit applications, making sure paperwork is organized, and, if necessary, assisting you in the appeals process. You’ll need to consult the SSA’s Blue Book listing to determine what records and medical documentation are necessary for your application for SSD benefits. Thus, it is not uncommon for people to say that working with a disability attorney and/or advocate is one of (1) the best ways to get and/or (2) signs your disability claim will be approved.
So, to give yourself the best chance at receiving the assistance you deserve, speak with a disability attorney today by filling out the Free Case Evaluation form on this page right now—all at zero cost to you. Use our Social Security benefits calculator to see how much you could be able to earn in disability benefits.
Connect with a Social Security Attorney near you today for the best chance at benefit approval.
Additional Resources
- Disability Lawyers Near Me
- Disability Benefits Claims 101: How to Get Started
- What Is SSDI
- Difference Between SSI and SSDI
- What Are the Qualifying Conditions for SSDI?
- Is Mental Illness a Disability?
- What Conditions Automatically Qualify You for Disability
- What Medical Conditions Qualify for Disability?
- Do You Qualify for Social Security Disability?
- What Heart Problems Qualify for Disability?
- What Eye Problems Qualify for Disability?
- Is Neuropathy A Disability
- Is Arthritis A Disability
- Chances of Getting Disability for Arthritis
- How Long Does it Take to Get Disability Approval Letter
